1
2
3
4
5
6
7
8
9
10
11
12
13
14
15
16
17
18
19
20
21
22
23
24
25
26
27
28
29
30
31
32
| library(googleAuthR)
library(ggplot2)
library(rsconnect)
library(googleAuthR)
library(googlesheets4)
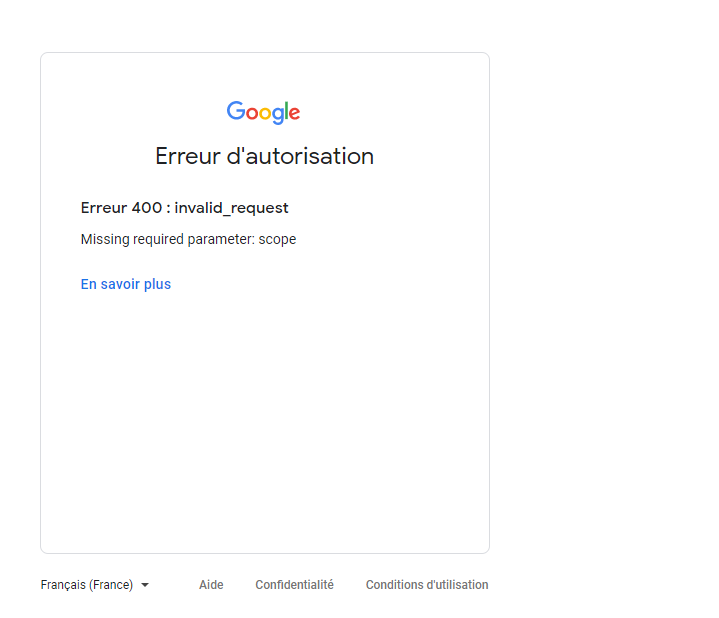
gar_auth_service("306515-08e39bec4019.json",scope ="https://www.googleapis.com/auth/cloud-platform")
# code de connection Shiny
rsconnect::setAccountInfo(name='testcrossjoin', token='', secret='')
# Connection à la feuille Google
BDD<-as.data.frame(read_sheet("https://docs.google.com/spreadsheets/d/10LN6anjrPNvaXZt9aCiq0zGMmNI6R2ngsdkf0SeIYyU/edit#gid=594536827",sheet="test"))
BDD
ui <- fluidPage(
titlePanel(title=h4("Races", align="center")),
mainPanel(
plotOutput("plot1")
)
)
server <- function(input,output){
output$plot1<-renderPlot({
ggplot(BDD,aes(BDD[,1],BDD[,2]))+geom_point(color='blue')
})
}
shinyApp(gar_shiny_ui(ui, login_ui = gar_shiny_login_ui), server) |


 Répondre avec citation
Partager